
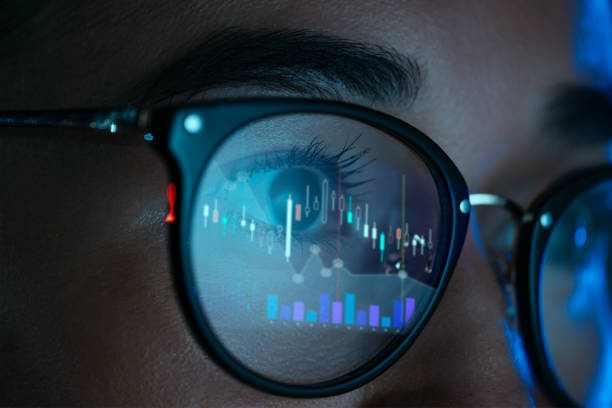
Crypto markets never sleep. Unlike traditional assets that follow strict market hours,
cryptocurrencies trade around the clock, making trend analysis more demanding and more
rewarding at the same time. For traders looking to stay ahead of the curve, the combination of strong technical tools and smart strategy matters. That is where TradingView earns its
spot as a daily essential for crypto trend watchers.
Reading trend direction with confidence
Identifying the direction of a trend is often harder than it seems. In crypto, volatility and
fakeouts can make even the strongest trend feel unstable. To gain clarity, traders on
TradingView often rely on structure-based tools like trendlines, moving average ribbons,
and anchored VWAP. These tools help establish whether a trend is building momentum or
running out of steam.
Anchoring a VWAP to a significant low or high can reveal the true average price buyers or
sellers have participated at. It turns chaotic charts into measured, weighted narratives that
let you plan entries and exits with greater conviction.
Using multi-timeframe setups for better insight
One of the most underused advantages of TradingView is its ability to compare multiple
timeframes within a single layout. A coin may look bullish on the 15-minute chart but bearish
on the daily. Seeing both perspectives at once keeps you grounded and prevents tunnel
vision.
This feature allows for smoother top-down analysis. Start from the weekly to identify the
long-term trend. Zoom into the daily for swing opportunities. Then move into the intraday
view for ideal entries. The more angles you see, the more accurate your strategy becomes.
Volume analysis in the crypto world
Volume in crypto works differently than in traditional markets. There is no centralized
exchange, and that can make reading volume trickier. Still, TradingView aggregates data
from various exchanges, giving a fairly reliable picture of where interest is building or fading.
Look for volume surges on breakouts. If the price moves without an increase in volume, the
move often lacks conviction. Traders using the volume profile and on-balance volume
indicators on TradingView are better equipped to detect whether a breakout is a true move
or a short-lived takeout.
Drawing dynamic support and resistance zones
Crypto does not behave like regulated markets. Prices can overshoot or fall through levels
dramatically. Static support and resistance lines are often too rigid. Instead, many traders
prefer drawing zones rather than exact levels. This approach reflects market psychology
more realistically.
TradingView makes this process easy with custom drawing tools. You can create
transparent zones that stay on your chart, helping you identify areas where price reacts
repeatedly. Over time, these zones form the basis of high-probability trading setups.
Tracking sentiment shifts with open-source scripts
The beauty of TradingView is not just the built-in tools but the community behind them.
Crypto traders across the world share scripts that measure things like funding rates,
liquidation levels, and sentiment extremes. These indicators go beyond the chart and reflect
trader behavior.
When these metrics align with price and volume signals, it adds another layer of
confirmation. Whether you are tracking Bitcoin dominance or scanning altcoin breakouts,
TradingView lets you combine technical precision with real-time crowd behavior.
Crypto markets are fast, emotional, and often irrational. That is what makes them exciting.
But to thrive in them, traders need clarity, structure, and tools that adjust to the chaos. With
its real-time charts, customizable layouts, and rich community, TradingView offers the
foundation to navigate crypto with purpose.